Main Menu
- Home
- Products
- Applications
- Product Support
- Service
- Learn
- Product News
- About Us
- Contact Us
 Quality indicators and ratings (Poor, Fair, Good) for Room Acoustic measurements are adapted from measurement procedures described in ISO 3382-1(2009), ISO 3382-2(2008) and application engineering recommendations for the SoundAdvisor™ Sound Level
Meter Model 831C. They are designed to help determine the quality of a given measurement and guide measurement improvements.
Quality indicators and ratings (Poor, Fair, Good) for Room Acoustic measurements are adapted from measurement procedures described in ISO 3382-1(2009), ISO 3382-2(2008) and application engineering recommendations for the SoundAdvisor™ Sound Level
Meter Model 831C. They are designed to help determine the quality of a given measurement and guide measurement improvements.
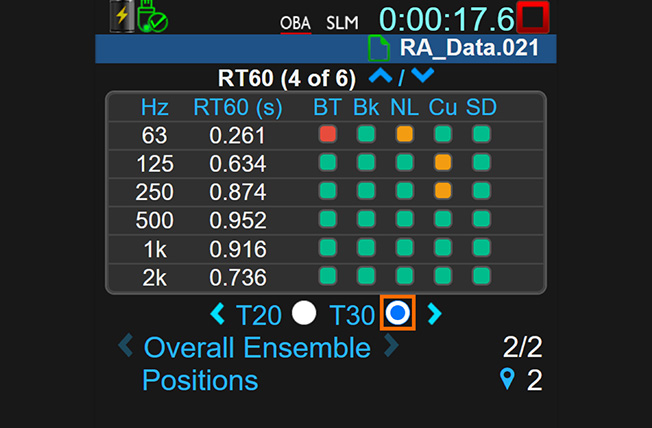
BT is the product of the 1/1 or 1/3 octave filter bandwidth and the T20 or T30 decay time for that frequency band. Good verifies that the measured decay is acoustic and not of the instrumentation. A poor rating may indicate the reverberation time was influenced by the decay time of the bandpass filter (ISO 3382-2:2008, 7.3, equation 4).
| BT ≤ 16 | |
| N/A | |
| BT > 16 |
BK is the difference between the signal used to energize the room and the background noise. (ISO 3382-2:2008, Sections 5.2.1 and 5.3.2). It offers an indication of how sufficiently the room was energized above the background noise level.
| T20 Measurement: BK < 35 dB T30 Measurement: BK < 45 dB | |
| N/A | |
| T20 Measurement: BK ≥ 35 dB T30 Measurement: BK ≥ 45 dB |
NL is the measurement of how well the decay follows a straight line. Non-linearity is reported as per mille ‰ (parts per thousand) deviation from zero or perfect linearity for T20 and T30 (ISO 3382-2:2008, Annex B.2).
Non-linear results are not always an indication of a poor measurement, but may be the result of reverberations off of acoustic ceiling tiles, coupled spaces, etc. Follow best practices recommended in your chosen standard. Ensemble averages typically reduce non-linear responses from abnormal causes.
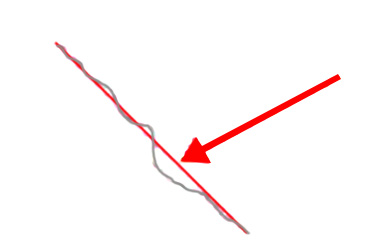
Decay with non-linearity – further examination is required
| > 10% deviation between the Decay Curve and the Regression Line | |
| 5% < deviation ≤ 10% | |
| ≤ 5%deviation |
Cu is the ratio of T30 to T20 decay times expressed as a percentage (ISO 3382-2:2008, Annex B.2). When the T20 and T30 decays times are the same, the Curvature is 0%.
| Cu >10% The graph of this type of decay may show the T20 or T30 lines intercepting the x-axis (time domain) at very different times. Rather than indicating a poor measurement, it may instead be the result of reverberations off acoustic ceiling tiles, coupled spaces, etc. Follow best practices recommended in your chosen standard. | |
| 5% < Cu ≤ 10% | |
| 0% ≤ Cu ≤ 5% A negative value may indicate a measurement error. |
SD is an estimate of uncertainty due to the number of averages used to calculate T60. The standard deviation typically decreases as the number of decays and positions increases. The 831C reports SD/RT as a percentage. See ISO 3382-2:2008, section 7.2 for calculation details.
| SD > 10% | |
| 5% < SD ≤ 10% | |
| SD ≤ 5% |