Main Menu
- Home
- Products
- Applications
- Product Support
- Service
- Learn
- Product News
- About Us
- Contact Us
 We get it. Acoustic Terminology can get complicated. Find definitions of common sound measurement terminology below - we explain the definition in mathematical terms and in practice. If you still have questions or have suggestions for additions to the glossary, our team of technical experts is always ready to lend a helping hand - feel free to get in touch today.
Frequency weightings are commonly used frequency filters that adjust the amplitude of all parts of the frequency spectrum of the sound or vibration

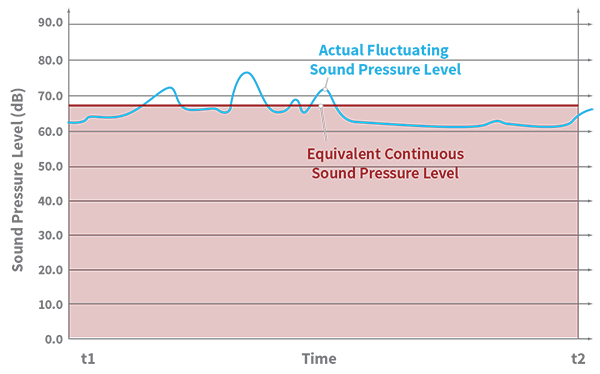
Leq is the level of a constant sound over a specific time period that has the same sound energy as the actual (unsteady) sound over the same period.
where p is the sound pressure and the Measurement Duration (specific time period) is T=T2-T1.
In other words, the actual sound pressure levels will vary all throughout a measurement period. Imagine creating a continuous sound throughout that same period with the same total sound energy as the actual varying sound levels. That continuous sound pressure level is Leq.
Time-weighted Sound Level is defined by the following equation
where
Source for above equation: IEC 61672-1:2013
Think of time-weighted sound levels as a kind of running average of sound level.
Why do we use time weighted sound levels? There are two main reasons. First, it is a closer representation of how the human ear perceives sound. Second, it's a
holdover from the days of analog sound level meters. Back in the early days of measuring sound, everything was analog and there were no digital readouts, only a needle. When these early meters were conceptualized, the inventors quickly realized that
if the needle went up and down with sound pressure level then it would move so fast that it would be a blur and couldn't be seen. These designers figured out a way to slow down the needle in a way that could be easily realized using analog components
while still reporting the energy levels correctly.
Two standards were defined: slow and fast, referring to how the needle on the meter generally moved. In simple terms, this method implemented a type of running average that today is called
a "time weighting" or "detector." Because so much early research was done and data were collected using time-weightings, these weightings continue to be widely used today. Slow weighting uses a time constant of 1 second. Fast weighting uses a time
constant of 1/8 second or 125 milliseconds. There is also a less commonly used weighting know as impulse weighting. It is used to measure extremely short bursts of sounds and has a rise time of 35 milliseconds. Impulse time weighting has a fall time
of 1.5 seconds, so it is asymmetric. It should be noted that "I" time weighting does not correctly report energy levels due to the asymmetry.
The peak sound pressure (P, measured in Pascals) is the greatest absolute value of the instantaneous (non-time-weighted) sound pressure during a particular time interval.
Lpeak is the highest instantaneous sound level, in decibels, with no time weighting (see above). It is important to remember that sound is a wave - a vibration as pressure oscillates through a medium (most often in our everyday lives, that medium is air).
Lpeak is measured in decibels and is twenty times the logarithm to the base ten of the ratio of a peak sound pressure to the reference sound pressure.
Where
P is the absolute value of peak sound pressure in Pascals and P0 is the reference sound pressure, -20 µPa.
Most of the time, Lpeak is
not the most important consideration in characterizing a sound or its effect on the human ear. Our ears perceive sound as an overall level over a short period of time and are more affected by that time-weighted sound level than an instantaneous peak
level.
Consider a pure tone such as that emanating from the acoustic calibrator that is used when field calibrating a sound level meter. The pressure generated from the calibrator is in the form of a sine wave. The peak sound pressure
of that wave is 1.414 or 2√2 times higher than the RMS value of the wave.
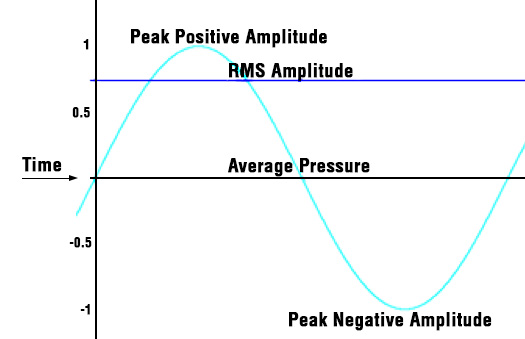
Just a note here that the RMS value of the wave over a given time period is called Leq (more info on Leq elsewhere on this page). For the pure tone discussed above, Lmax equals Leq. In this case, Lpeak will be 3 dB above Lmax (which, again, for steady signals only is equal to the Root Mean Square of the wave). For varying signals, Lpeak and Lmax can be vastly different. In the case of a varying signal, Lpeak cannot be calculated from Lmax or any other measurement.
Lmax is the highest time-weighted sound level measured by the meter during a given period of time (the maximum of the output of the time weighted sound level equation above). The time constant used can be fast or slow. Often, this parameter will be described along with information about the weightings used (for example, LAFmax indicates the maximum level measured with fast detector and A-weighting). Once again, this is NOT the same as Lpeak!
Lmin is the lowest time-weighted sound level measured by the meter over a given period of time (the minimum of the output of the time weighted sound level equation above). Just like for Lmax, the value is based on the time weighted sound level in dB. The time constant used can be fast or slow.
The total time-weighted average sound exposure for an individual worker over an 8 hour work day. This is expressed in the form of a percentage of total allowable sound exposure. If the worker is exposed to varying noise levels throughout the day, it is convenient to measure noise dose with a noise dosimeter. Without a dosimeter, it can get complicated to compute overall noise dose for varying noise levels, because decibel levels can't be simply averaged. (Noise levels are measured on a logarithmic scale.) Allowable noise dose is not universally agreed upon. There are specific standards in place in the EU, the US, Canada, Australia, and elsewhere. For more terminology related to occupational noise and worker noise dose, see Noise Dosimetry Terminology.
Bin Max is one of 2 choices for the Max Spec setting on the OBA Page of the Setup Manager. See also "At Lmax." Bin Max is the maximum value that occurred during the entire measurement for that frequency band. Since individual frequency bands may reach their maximum levels at different times, this spectrum might be one which never occurred at any instant during the measurement period.
A rating of community noise exposure to all sources of sound that differentiates between daytime, evening and nighttime noise exposure. The equation for it is
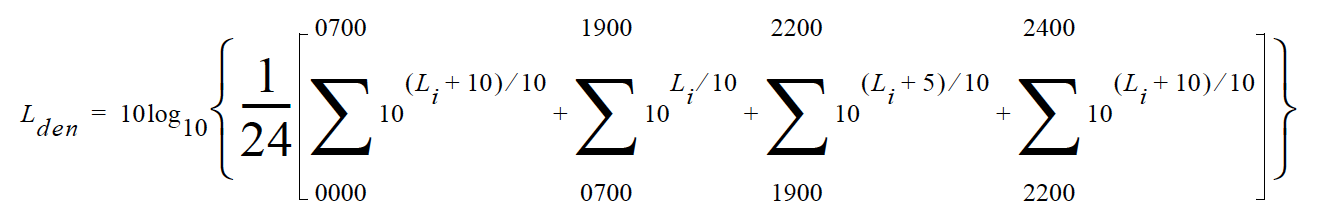
The continuous equivalent sound level is generally calculated on an hourly basis and is shown in the equation as L. The levels for the hourly periods from midnight to 7 a.m. have 10 added to them to represent less tolerance for noise during sleeping hours. The same occurs from 10 p.m. to midnight. The levels for the hourly periods between 7 p.m. and 10 p.m. have 5 added to them to represent a lessened tolerance for noise during evening activities. They are energy summed and converted to an average noise exposure rating.
A rating of community noise exposure to all sources of sound that differentiates between daytime and nighttime noise exposure. The equation for it is
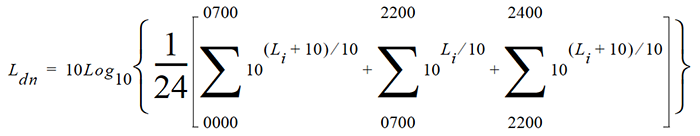
The continuous equivalent sound level (See definition) is generally calculated on an hourly basis and is shown in the equation as L.
The values for the hourly periods from midnight to 7 a.m. have 10 added to them to represent less tolerance for noise during sleeping hours. The same occurs from 10 p.m. to midnight. They are energy summed and converted to an average noise exposure rating.
A logarithmic form of any measured physical quantity and commonly used in the measurement of sound and vibration. Whenever the word level is used, this logarithmic form is implied. The decibel provides us with the possibility of representing a large span of signal levels in a simple manner as opposed to using the basic unit Pascal for acoustic measurements.
It is not possible to directly add or subtract physical quantities when expressed in decibel form since the addition of logarithmic values correspond to multiplication of the original quantity.
The word level is normally attached to a physical quantity when expressed in decibels; for example, Lp represents the sound pressure level.
The difference between the sound pressure for silence versus loud sounds is a factor of 1,000,000:1 or more, and it is very unpractical to use these large numbers. Therefore, a measure that would relate to “the number of zeros” would help, for example, 100,000 would be equal to 50 and 1000 would be equal to 30 and so on. This is the basic principal of the dB measure.
All dB values are unit free and therefore, the dB value is not the value of the quantity itself, but the ratio of that quantity to an actual reference quantity used. Thus, for every level in decibels there must be a well defined reference quantity. Sound versus vibration uses different references, but the dB principal is the same. When the quantity equals the reference quantity the level is zero. To keep dB values above zero, the reference is generally set to be the lowest value of the quantity that we can imagine or normally wish to use. Before explaining the calculation of dB values, it is useful to remember the following rules of thumb when dB values are used for sound levels:
Note: The latter is frequency and level dependent, but the value “10 dB” is a good rule of thumb, especially around 1 kHz.
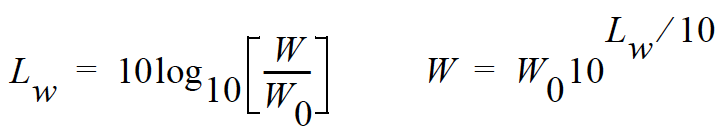
Table C.1 shows the actual value of a specific item, such as sound power, for which the sound level is calculated. First, the sound power value is divided with the reference used and then the ten based logarithm is applied. This value is then multiplied by 10 to create the decibel value (see equation below).
For every 10 decibels, a unit called Bel is created. The decibel stands for: deci for “one tenth” and bel for “Bel” (compare decimeter). The relationship between Bel and decibel is thus: 1 Bel = 10 decibels. It is not possible to directly add or subtract decibel values, since addition of logarithmic values correspond to multiplication of the original quantity.
Table C.1 Sound Level
| Power form, squared units | Level form | |
|---|---|---|
| Ration of Value to Reference | Exponential Form of Ratio | 10•Exponent |
| 1 | 100 | 0 |
| 10 | 101 | 10 |
| 100 | 102 | 20 |
| 200 | 102.3 | 23 |
| 1,000 | 103 | 30 |
| 10,000 | 104 | 40 |
| 100,000 | 105 | 50 |
| 1,000,000 | 106 | 60 |
Each time the sound pressure level increases by 6 dB, the corresponding sound pressure value is doubled and thus multiplied by 2. Each time the sound power level increases by 3 dB, the sound power value is multiplied by 2. Thus, it is important to notice that a doubling of the sound power is equal to 3 dB, and a doubling of the sound pressure is equal to 6 dB, since a doubling of the sound pressure will result in a quadruple increase of the sound power. The advantage with using dB is simply that they remain the same even if we use sound pressure or sound power. Compare this to the use of voltage and power units in electrical engineering, units being related by P~V2. In table 2 an illustration is made of values calculated on sound pressure, non-squared units.
The original definition of decibel was intended for power-like quantities, such as sound power. If we consider sound pressure levels instead (usually denoted P in acoustics), the equation will be the same, since the “two” in the squared units will move from within the bracket and become a 20 log instead of a 10 log and thus compensate for using linear or quadratic units. Please note that it is not allowed to use 20 log for squared units, since that expression assumes that we use linear units, like sound pressure in acoustics or voltage in electrical engineering. This is illustrated in equation below:
Table C.1 illustrates how a a tenfold increase of the sound pressure will result in an increase in 20 dB steps, while sound power increases in 10 dB steps. See the linear form (Table C.1) and compare with equation above. In conclusion, dB values are always the same, independent of using sound power or sound pressure as the base unit. A 6 dB increase implies four times the sound power or two times the sound pressure.
| Linear form, non-squared units | Level form | |
|---|---|---|
| Ration of Value to Reference | Exponential Form of Ratio | 20•Exponent |
| 1 | 100 | 0 |
| 10 | 101 | 20 |
| 100 | 102 | 40 |
| 200 | 102.3 | 46 |
| 1,000 | 103 | 60 |
| 10,000 | 104 | 80 |
| 100,000 | 105 | 100 |
| 1,000,000 | 106 | 120 |
The detector converts the actual fluctuating sound from the microphone into a signal that indicates its amplitude. Your choice for the Detector setting (Slow, Fast, or Impulse) determines the amplitude change rate. The detector first squares the sound signal, then averages it in accordance with the time-weighting characteristic, and then takes the square root. This results in an amplitude described as rms (root-mean-square).
The Slow and Fast detector responses were originally developed to slow down the movement of the needle on an electro-mechanical meter, so that the amplitude could be determined. Slow and Fast detector settings are still useful in modern sound measurement instruments. Slow has a time constant of 1 second. Fast has a time constant of 1/8th second. The Impulse setting is a non-linear detector with the rise controlled by a 35 ms time constant followed by a peak hold that has a decay rate of 2.9 dB/second.
One of 2 integration methods used on the 831C SLM.
Exponential integration shows a long decay of energy after an impulse. However, it may hide small events or loud impulsive events. For this reason, this method is not as commonly used as "Linear Integration". Please note that when performing time history measurements of 10 ms or less, you must use Linear integration.
You can locate this setting by selecting any menu ➭ Setup Manager ➭ General.
There are two types of far fields: the acoustic far field and the geometric far field.
Acoustic Far Field: The distance from a source of sound is greater than an acoustic wavelength. In the far field, the effect of the type of sound source is negligible. Since the wavelength varies with frequency (See the definition of Wavelength), the distance will vary with frequency. To be in the far field for all frequencies measured, the lowest frequency should be chosen for determining the distance. For example, if the lowest frequency is 20 Hz, the wavelength at normal temperatures is near 56 ft. (17 m); at 1000 Hz, the wavelength is near 1.1 ft. (1/3 m). "Acoustic Near Field:" for the advantages of being in the acoustic far field.
Geometric Far Field: The distance from a source of sound is greater than the largest dimension of the sound source. In the far field, the effect of source geometry is negligible. Sound sources often have a variety of specific sources within them, such as exhaust and intake noise. When in the far field, the sources have all merged into one, so that measurements made even further away will be no different. "Geometric Near Field:" for the advantages of being in the geometric far field.
A sound field that is free of reflections. This does not mean that the sound is all coming from one direction as is often assumed, since the source of sound may be spatially extensive. See the definitions of near and far fields for more detail. This definition is often used in conjunction with reverberant field.
The rate at which an oscillating signal completes a complete cycle by returning to the original value. It can be expressed in cycles per second and the value has the unit symbol Hz (Hertz) added and the letter f is used for a universal descriptor. It can also be expressed in radians per second, which has no symbol, and the Greek letter w is used for a universal descriptor. The two expressions are related through the expression 𝞈=2Pf.
The part of certain sound level meters that divides the frequency spectrum on the sound or vibration into a part that is unchanged and a part that is filtered out. It can be composed of one or more of the following types:
Low Pass: A frequency filter that permits signals to pass through that have frequencies below a certain fixed frequency, called a cutoff frequency. It is used to discriminate against higher frequencies.
High Pass: A frequency filter that permits signals to pass through that have frequencies above a certain fixed frequency, called a cutoff frequency. It is used to discriminate against lower frequencies.
Bandpass: A frequency filter that permits signals to pass through that have frequencies above a certain fixed frequency, called a lower cutoff frequency, and below a certain fixed frequency, called an upper cutoff frequency. The difference between the two cutoff frequencies is called the bandwidth. It is used to discriminate against both lower and higher frequencies so it passes only a band of frequencies.
Octave band: A bandpass frequency filter that permits signals to pass through that have a bandwidth based on octaves. An octave is a doubling of frequency so the upper cutoff frequency is twice the lower cutoff frequency. This filter is often further subdivided in 1/3 and 1/12 octaves (3 and 12 bands per octave) for finer frequency resolution. Instruments with these filters have a sufficient number of them to cover the usual range of frequencies encountered in sound and vibration measurements.The frequency chosen to describe the band is that of the center frequency. Note table in Frequency Filter - Frequency Weighting.
See "Linear Integration", or "Exponential Integration".
A descriptor of a measured physical quantity, typically used in sound and vibration measurements. It is attached to the name of the physical quantity to denote that it is a logarithmic measure of the quantity and not the quantity itself. The word decibel is often added after the number to express the same thing. When frequency weighting is used the annotation is often expressed as dB(A) or dB(B).
One of 2 integration methods used on the 831C SLM.
This is the default and most commonly used integration method for measuring sound. Linear integrates only the energy during a given period. It does not show a decay slope of a Fast, Slow, or Impulse exponential detector. For additional information, see "Exponential Integration".
You can locate this setting by selecting any menu ➭ Setup Manager ➭ General.
The Ln value is the sound level that has exceeded n% over the total measurement time. For example, if n=90%, a displayed value of 35dB for L90 means that for 90% of the measurement period the dB level was at or above 35dB. These statistical values are commonly used to describe the characteristics of non-steady sound such as environmental noise.
To calculate Ln values, the 831C creates an amplitude distribution table over the range 0 to 200 dB, in amplitude increments of 0.1 dB. This data permits the calculation of Ln values for any value of n in the range 00.01 to 99.99%.
Locate the Ln values on the 831C by going to Setup Manager ➭ Ln Page.
There are two types of near fields: the acoustic near field and the geometric near field.
Acoustic Near Field: The distance from a source of sound is less than an acoustic wavelength. In the near field, the effect of the type of sound source is significant. Since the wavelength varies with frequency (See the definition of Wavelength), the distance will vary with frequency. The most common example of a near field is driving an automobile with an open window. As you move your ear to the plane of the window, the sound pressure level builds up rapidly (wind noise) since most of the pressure changes are to move the air and very little of it compresses the air to create sound. Persons not far way, can hardly hear what you hear. The acoustic near field is characterized by pressures that do not create sound that can be measured in the far field. Therefore measurements made here are not useful in predicting the sound levels far way or the sound power of the source.
Geometric Near Field: The distance from a source of sound is less than the largest dimension of the sound source. In the near field, effect of source geometry is significant. Sound sources often have a variety of specific sources within them, such as exhaust and intake noise. When in the near field, the sound of a weaker, but close, source can be louder than that of a more distant, but stronger, source. Therefore measurements made here can be used to separate the various sources of sound, but are not useful in predicting the sound levels and sound spectrum far from the source.
Typically noise is unwanted sound. This word adds the response of humans to the physical phenomenon of sound. The descriptor should be used only when negative effects on people are known to occur. Unfortunately, this word is used also to describe sounds with no tonal content (random):
Ambient: The all encompassing sound at a given location caused by all sources of sound. It is generally random, but need not be.
Background: The all encompassing sound at a given location caused by all sources of sound, but the source to be measured. It is essentially the sound that interferes with a measurement.
Pink: It is a random sound that maintains constant energy per octave. Pink light is similar to pink noise in that it has a higher level at the lower frequencies (red end of the spectrum).
White: It is a random sound that contains equal energy at each frequency. In this respect, it is similar to white light.
A preamplifier is a part of a sound level meter that matches a particular model of microphone to the meter. It must be chosen in conjunction with a microphone and a cable that connects them.
Sound is comprised of rapid oscillatory compression changes in a solid, liquid, or gas medium that propagate to distant points. It is characterized by changes in density, pressure, motion, and temperature. Not all rapid changes in the medium are sound since they do not propagate. Wind noise is an example of this. Sound can also be characterized as the auditory sensation evoked by the oscillatory changes.
Sound is the physical phenomenon associated with acoustic (small) pressure waves. Noise is unwanted sound that causes adverse effects in those exposed to it, such as hearing loss or annoyance. It can also be defined as the sound made by other people. In every case, choosing the word noise involves a judgment of whether the sound is welcome or not.
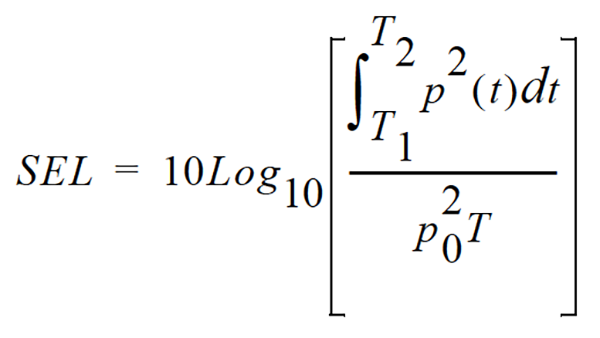
Similar to Leq in that the total sound energy is integrated over the measurement period, except that instead of averaging it over the measurement period, a reference duration of 1 second is used. It can also be thought of as the constant sound level that has the same amount of energy in one second as the total original noise event. SEL is often used as a way to compare the noise exposure from two noise events that have different durations.
SEL is usually expressed in Pascals squared-seconds or Pascals squared-hours. P0 is the reference pressure of 20 μPa and T is the reference time of 1 second. It is then put into logarithmic form. It’s important to note that this is not an average since the reference time is not the same as the integration time.
The following equation shows that the sound pressure is squared and integrated over a specific period of time (T2-T1).
Why use SEL? It's convenient to have one metric to compare the total energy of individual events taken over a long period of time. Imagine comparing total energy between events with different time durations, such as:
SEL helps quantify these events for comparison with each other.
Sound Pressure is the physical characteristic of sound that can be detected by microphones. Not all pressure signals detected by a microphone are sound (e.g., wind noise).
Sound Pressure is the amplitude of the oscillating sound pressure and is measured in Pascals (Pa), or Newtons per square meter, which is a metric equivalent of pounds per square inch. To measure sound, a sound level meter uses a detector to separate the oscillating pressure from the stead (barometric) pressure. The sound level meter then squares the pressure, takes the time average, and takes the square root (this is called rms for root-mean square). This method is one of several ways to mathematically measure sound.
Moving Average: The averaging process is continually accepting new data so it is similar to an exponential moving average. In the equation, the sound pressure is squared and multiplied by a exponential decay factor, so that when the time of integration is near the current time (t) it is essentially undiminished.
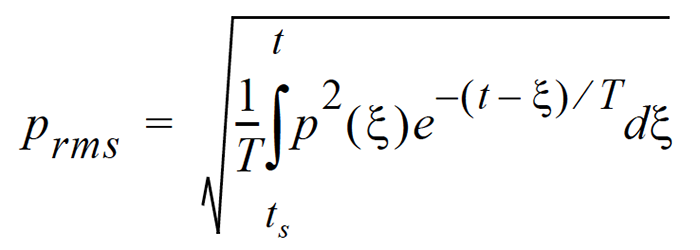
For times older (less) than the current time, the value is diminished and so becomes less important. The rate at which older data are made less influential is expressed by the constant T. The larger it is, the slower the decay factor reduces and the slower the response of the system to rapid changes. These are standardized into 3 values called Time Weighting. See the values below.
Fixed Average: The averaging process is over a fixed time period. The equation for it is
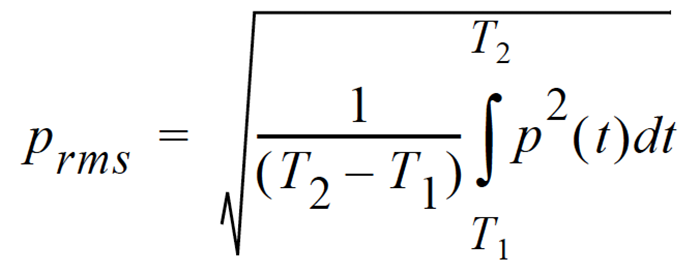
The sound pressure is squared and averaged over a fixed time period. Unlike the moving average, the sound pressures in all time intervals are equally weighted.
The sound power emitted by a sound source. It is measured in Watts.
The logarithmic form of sound power. It is also expressed by attachment of the word decibel to the number. The logarithm is taken of the ratio of the actual sound power to a reference sound power, which is 1 pico-watt. Sound power level cannot be measured directly, but can only be deduced through measurements of sound intensity or sound pressure around the source. The equation for it is
The speed at which sound waves propagate. It is measured in meters per second. It should not be confused with sound or particle velocity which relates to the physical motion of the medium itself.
The amplitude of sound or vibration at various frequencies. It is given by a set of numbers that describe the amplitude at each frequency or band of frequencies. It is often prefixed with a descriptor that identifies it such as sound pressure spectrum. It is generally expressed as a spectrum level.
An integration of the five second maximum A frequency weighted, fast time weighted sound pressure levels.
Where:
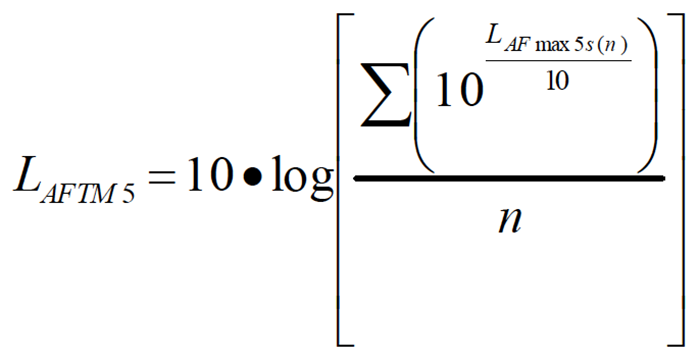
LAmax 5s(n) is the maximum A-weighted fast exponential time weighted sound pressure level for each n 5-second time period and n is the number of 5 second periods accumulated during the measurement.
The response speed of the detector in a sound level meter. There are several speeds used.
Slow: The time constant is 1 second (1000 ms). This is the slowest and is commonly used in environmental noise measurements.
Fast: The time constant is 1/8 second (125 ms). This is a less commonly used weighting but will detect changes in sound level more rapidly.
Impulse: The time constant is 35ms for the rise and 1.5 seconds (1500 ms) for the decay. The reason for the double constant is to allow the very short signal to be captured and displayed.
The oscillatory movement of a mechanical system (generally taken to be solid). It is used as a broad descriptor of oscillations.
The distance between peaks of a propagating wave with a well defined frequency. It is related to the frequency through the following equation
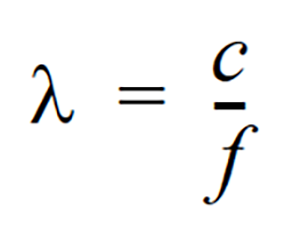
where c is the sound speed and f is the frequency in Hz. It has the dimensions of length.
A number that is related to the wavelength of sound and is used to compare the size of objects relative to the wavelength or the time delay in sound propagation. It is related to wavelength through the following equation
where l is the wavelength, c is the sound speed, f is the frequency in Hz, and w is the radian frequency. It has the dimensions of inverse length.