Main Menu
- Home
- Products
- Applications
- Product Support
- Service
- Learn
- Product News
- About Us
- Contact Us
The HVManager software can perform the following three activities:
The HVManager can work with the two types of measured vibration data listed below. Separate routines are used for each of these data types.
The records can be shown on a user selected graphics display of RMS and Peak values and as a table of averaged values for the number of measurements required for both Hand/Arm and Whole Body.
When the database is opened, be it a previously existing one or one that was just created, the Graphics Display will look as shown in the following figure for a Hand/Arm or Whole Body measurements showing RMS values of X; Y; Z; and Sum RMS (X/Y/Z) and Peak values of X; Y; Z; and Sum Peak (X/Y/Z):

When the averaged values are displayed the tabular screen will look as shown in the following figure:

Averaging: By averaging multiple records, it is possible to obtain typical vibration values. For example, by having multiple operators perform the same operation and averaging the records for each, a more typical set of data can be obtained to represent that tool for that specific operation.
In the United Kingdom, on the other hand, the legislation specifies that the database should provide an averaged record for both high and low usage.
Note: that when selecting to view more records, the "Include" check box to the right of each record is automatically checked. Individual records can be unchecked by left clicking on the already checked check box, which will remove their data from the averaging process.
The Aeq Average (X, Y and Z) values displayed in "Four Record Display" on the above page now represent the average values for the four records and the Database data at the bottom corresponds to the four records. Also, since there are multiple records, a Standard deviation value for the Aeq values is displayed. There must be at least four records in the average in order for the standard deviation to be displayed.
Units: There are six different units which can be used to represent the Database data displayed at the bottom of the display. To make a unit selection, left click on the down arrow to the right of the Units field, which will open a drop down menu listing the possible selections as shown in the following figure:

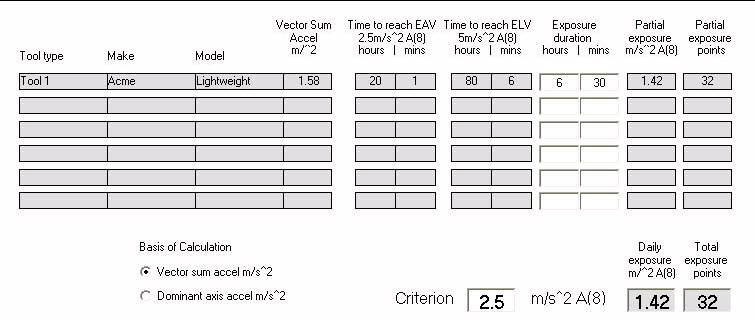
The results table below shows one Tool or Process, however tables can support the results of more than single tools or processes: