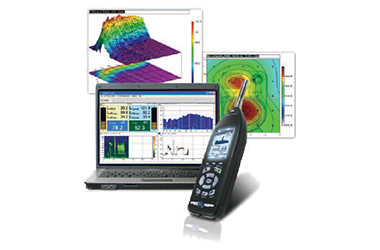
DNA Software
Acoustic and vibration measurement software!
Analyzing noise and vibration data can be difficult. Its not often easy to see the patterns or recognize the nuances of complex data sets. Furthermore, presenting data in a way that is meaningful can be challenging, yet perhaps our most important task.
DNA (Data, Navigation, and Analysis) makes maneuvering through extensive data a simple operation and putting together meaningful reports has never been easier. Some of DNAs many features include:
Windows XP Pro SP2, Vista Business setup and control of Larson Davis Models 831, SoundTrack LxT, HVM100, 720, 812, 820, 824, 2900B, & 3000+.
Multiple live data displays on the PC screen.
Stream data directly from analyzer to PC hard drive, including sound files.
Read stored data files from analyzer or disk.
Create report templates for easy graphing and printing.
|
|
Organize templates, graphics, and measurements for easy recall.
Reports can integrate text, graphics, pictures, or embedded objects (OLE 2.0) such as MS Word, MS Excel and .WAV files.
Graph 1/1, 1/3, 1/12, 1/24 octave, FFT and zoom FFT, SLM parameters; statistical distribution and more!
Cursor synchronization between different types of graphics with drag and drop functionality for use in a wide variety of applications.
Research and Development
Building Acoustics
Sound Power Determination
Vibration Measurements
Statistics
Pass-by
Sound Intensity
Simple Point and Shoot
Transient Capture
Environmental
Aircraft Noise
Industrial Noise
General Surveys
Transportation Noise
Community Noise
Events and Tone
Worker Safety
Work Place Surveys
Machinery Noise
|

Building Acoustics - RT-60s
at multiple frequencies
|

Acoustic Intensity superimposed on a drawing
|

Waterfall
|

Automotive - Order Tracking with spectrogram
|
One Software Package for Unlimited Needs
DNA was developed to integrate and fully support all types of measurements made with Larson Davis noise and vibration instrumentation. It replaces the need for several different software applications to achieve what you really want for display, analysis, and reporting of all project measurement data. DNA quickly produces high quality charts, reports, and presentations.
Real-time Display Mode
DNA displays and controls measurement data on a PC in real-time, while maintaining access to all of the instruments measurement and analysis functions.
WYSIWYG
DNA is What You See Is What You Get software. You place, resize, and manipulate graphical objects, images, graphs, text, and other types of objects on a page. What you see displayed on the screen remains unchanged on the printed report.
Instruments Supported
DNA software interfaces with the Larson Davis Models 831, SoundTrack LxT, HVM100, 812, 820, 824, 2900B, & 3200+ via USB, RS-232 and RS-422. It provides instrument setup and direct conversion and display of data files.
Measurement Organization
DNA saves all measurement-related files as elements of a project file. Project files can contain measurement data, page descriptions, images, audio files, etc. All data are organized in a tree structure (like Windows Explorer). In addition, DNA allows you to drag & drop any object onto project reports.
Graphics
It is possible to perform any kind of graphic presentation with dimensions, scaling, dotted lines, bar graphs, overlaying, linear and log scales, EU, cursor synchronized among the graphics displayed, etc. Any combination of graphs and objects (even an entire document) can be saved as a template. In addition, you can perform cumulative distribution versus time and for each frequency band, percentile Ln versus time and frequency; frequency versus time, speed, distance or rpm; order analysis, RT-60, etc.
Data Post-Processing
|
The statistical calculation is made on the temporal sequence of levels, or spectra in 1/3, 1/12, 1/24 octave or FFT.
|
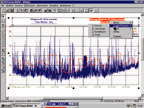
DNA calculates functions including all mathematical operations from data blocks, spectra, multi-spectra, levels versus time, engine revolution or speed, and more. Levels of selected spectral bands can be modified or cancelled, both in frequency and in time domain, for data matrix or multi-spectra. Several weighting curves are included with the software.
Optional Modules
DNA can be expanded to meet your measurement needs with the following modules:
PC Direct Store
Stores data directly to a PCs hard drive
Intended for applications where instrument memory is not sufficient, e.g. environmental monitoring, passbys, and long run-up
File Audio
Stores time domain signal from the instrument to the PC sound card, and then to the hard drive
Sound file can be attached to a graph or page
Creates .WAV files
Order Tracking Analysis
Order extraction from autostore by-Tach
Graphics template for order analysis
Spectrum vs RPM or Speed for frequency or order
Building Acoustics
RT-60 with backward Schroeder Integration
ISO R140 & ISO 717
ASTM E90-E336 & ASTM E007
Acoustic Intensity
Support for ISO 9614
Contour plotting (planar only)
Overlay on DXF Autocad file of the measurement surface
General
WYSIWYG display. The working page is the same as the printout.
Support for 831, SoundTrack LxT, HVM100, 720, 812, 820, 824, 2900B, 3000+
Data Input
Import data via floppy disk, USB, RS-232, RS-422, and modem.
Real-time control of all measurement and analysis functions of the instrument.
Automatic identification of noise events.
Easy management of the various instrument setup parameters.
Data files for waveforms, statistics, frequency analysis in 1/1, 1/3, 1/12, 1/24 octave and FFT with any kind of spectral resolution, crosspectra, module, phase, real and imaginary part, spectrum, multispectra, harmonic orders, meteorological signals, voltage, current, etc.
Measurement file with icons (Measurements Organizer) with Drag and Drop functions for quick selection.
Graphics
Management of graphics, numerical tables, comments, dynamic markers, digital photos, and video clips.
Direct import of image files as metafile WMF and EMF or bitmap as DIB or BMP.
X, Y, and Z axis definable as linear or logrithmic with selectable values, or using autoscale.
Single or multiple cursors synchronized among the displayed graphs.
Alignment of graphics and objects.
Post Processing
Cut & paste between sequences acquired in the time domain.
Measurement recalibration and level modification in frequency and time domain.
Spectrograms and 3D graphics (waterfall).
Mathematical functions, masks in time and frequency domain, automatic identification of the events, tonal components, etc.
Creation of the curve family as ISO-NR, ISO-2633, Isophonics ISO-226, etc.
Weighting curves.
Statistics on the overall value and per frequency band, also in FFT
Other
OLE 2.0 (client) with all Microsoft applications
Copy and paste through clipboard both for graphics and numerical tables
Undo
Email documents
On-line help
Print preview with multiple pages of a document
Options
Pass-by data calculation
Direct data acquisition in to PC .WAV files of an event
DNA software features and functions apply only to Larson Davis products which support them.
Specifications are subject to change without notice.
Return to Software Products Page